I have been lucky to have been blessed with seven children. They are now all adults. The majority have yet to start investing for the future despite the occasional admonishment from me. That’s a really bad idea for them and for anyone who has followed the same path.
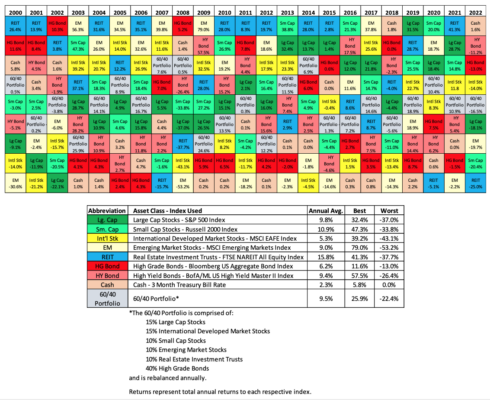
The chart below offers a very simple and elegant explanation of why everyone needs to get their money invested and working for their future.
Asset Class Returns
Comparing Asset Classes and Returns over 23 years
Looking at the chart, you can see that there are nine asset classes represented with the return to each class indicated for each of the twenty-three years shown.
If you look carefully, you will see that the return to cash (think of your bank account or money market fund as an equivalent) has been below the median for all but seven of those years. More to the point, the annual average return was a paltry 2.3%.
Intellectually, you may be able to grasp the importance of the information in the preceding paragraph. But to make sure, let’s put the implications into real world, dollar and cents, terms.
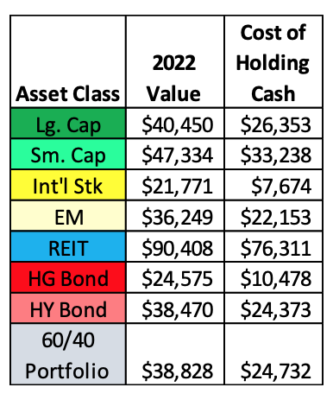
If you had put $10,000 into “cash” at the end of the last century (1999), that $10,000 would have grown into $14,097 by the end of 2022.
What about the other asset classes?

The table above makes the real cost of holding cash crystal clear.
Cash can, under certain circumstances, provide an above average return for limited periods of time, but the historical record presented suggests that those instances are few and far between.
Cash underperformed every one of the other asset classes over the full period. 
While, of course, the future will be different from the past, this sample period covers economic booms and busts and extremes of market strength and weakness.
There’s more ...
As if its last place finish weren’t bad enough, over this period the inflation rate, as measured by the Consumer Price Index, averaged 2.5%. Comparing that 2.5% rate of inflation to the 2.3% average annual return to cash, the $14,097 in cash that would have been in your bank account at year-end 2022 would have purchased even less in real terms than the $10,000 you started out with at year-end 1999.
What about rolling five-year returns?
I also looked at rolling five-year returns. Cash never came close to matching the 60/40 Portfolio.


You must be logged in to post a comment.